What can it do?
The PocketLab Air is a consumer air quality sensor from the US company Myriad Sensors which has made many popular sensors for use by the general public and educators; mainly in the area of physics. This new sensor is able to collect data on air quality parameters, as well as the measurement conditions. The measurement parameters include light intensity, relative humidity, barometric pressure, and temperature. Air quality is assessed by an ozone sensor which is partially sensitive to nitrogen oxides, a carbon dioxide sensore, and a particulate matter (PM) sensor which is able to measure PM smaller than a diameter of 10, 2.5, and 1 μm in diameter which is abbreviated to PM10, PM2.5, and PM1 respectively. Sometimes PM2.5 is also called fine particulate matter. All three particulate matter sizes are used to calculate an air quality index (AQI) from 0 - 500 which is used by the US Environmental Protection Agency (EPA). In the future Myriad sensors hopes to support other air quality indexes like the air quality health index (AQHI) used by Canada.
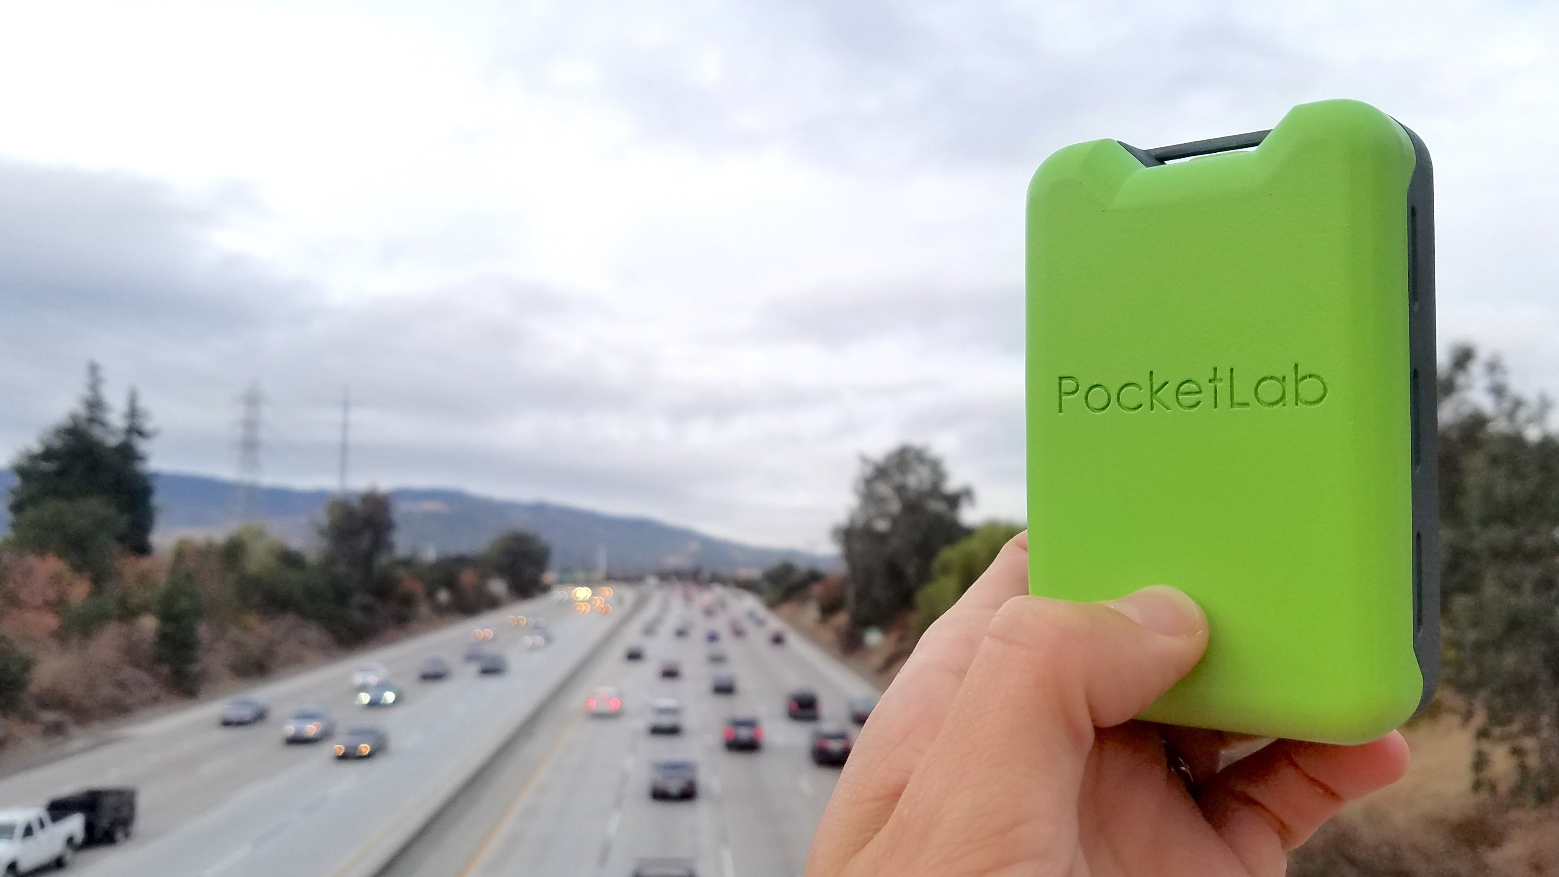
The PocketLab Air packages all of these sensors into one unit along with on board memory for 30,000 data points and Bluetooth 4.0 capabilities to either retrieve logged data or collect it live via your device. The PocketLab Air will work with Windows 10, Chrome books, MacOS, iOS, and Android devices that have Bluetooth capabilities. All of the parameters can be collected at once and viewed as a graph with the current value listed above or on a map with the current geotagged location and value shown. When used with a mobile device data can even be overlaid onto video produced by the device's camera(s). Once data is recorded it can be analysed in the app, exported to a comma-separated value (.cvs) file, or uploaded to Myriad Sensor's CloudLab to be revisisted later and or to share with Mission Mode.