3. The app

After you have built your air sensor quality and completed the coding for it, the next step is building an app for your smartphone.* This app will allow you to tell your sensor to collect data, and will then document the data that is collected. The app can be built using an online tool that is free of charge.The steps to building your app are below.
*Currently the app is only compatible with Android smartphones.
1. Starting the project
The app can be built using an online tool called MIT App Inventor 2. To access this website, click here.
You will be asked to sign in with a google account. Once you log in, click “Start new project”.
You will then be prompted to name the project. This will be the name of the app when it is appears on your mobile device.
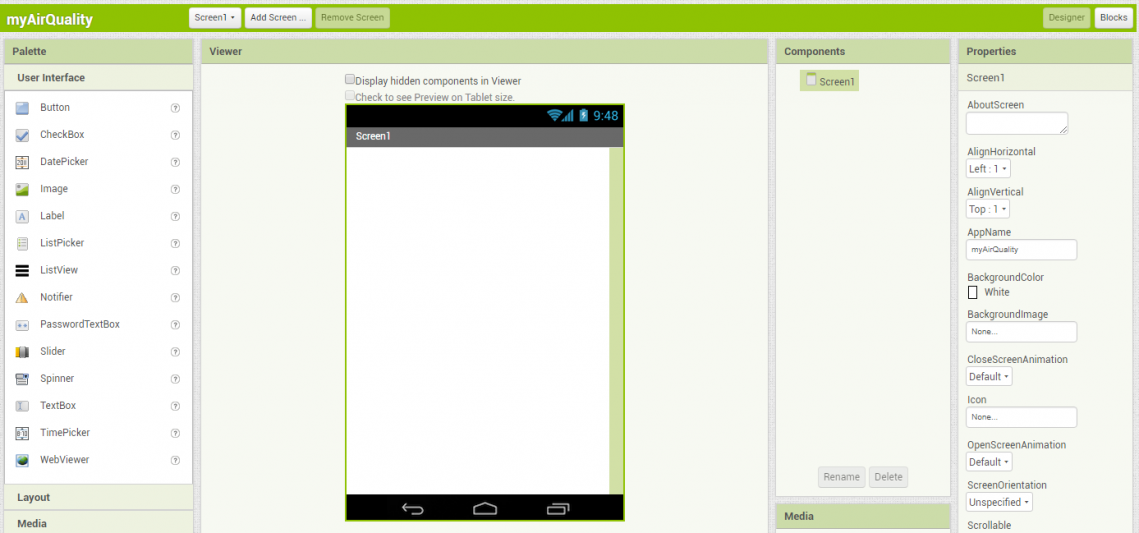
After naming your project, you should now see the screen that appears below.
You will find a blank mobile screen in the middle, a palette on the left and components and properties on the right.
2. Designing your app
a) Drag a “Label” from the “user interface” menu to the top of the mobile screen.
Under Properties, change the following:
- Width to “Fill parent”
- Text to “Not Connected”
- TextAlignment to “Center”
- TextColor to “Red”
b) Drag a “ListPicker” underneath the label. Change the following:
- Width to “Fill parent”
- Text to “Select Device”
- TextAlignment to “Center:”
c) Drag a “Button” underneath the ListPicker. Change the following:
- Width to “Fill parent”
- Text to “Collect”
d) Drag a “VerticalScrollArrangement” from the “Layout” menu underneath
the “Collect” button. Change the following:
- BackgroundColor to “None”
- Height to “65 percent”
- Width to “Fill parent”
e) Drag another “Label” into the “VerticalScrollArrangement”. Change the following:
- Height to “Fill parent”
- Width to “Fill parent”
- Text to nothing (leave blank)
f) Drag a “HorizontalArrangement” underneath the “VerticalScrollArrangement”.
Change the following:
- BackgroundColor to “None”
- Height to “10 percent”
- Width to “Fill parent”
g) Drag two buttons into the HorizontalArrangement. Change the following:
- Widths to “50 percent”
- Name one “Share” and the other “Clear”
h) Drag “BluetoothClient” from the “Connectivity” menu, “Clock” from the “Sensors” menu, and “Sharing” from the “Social” menu to any-where on the mobile screen
i) Under “Components” rename the following:
- “Label1” to “Connection Label”
- “ListPicker1” to “Select Device”
- “Button1” to “Collect”
- “Label2” to “Data Screen”
- “Button2” to “Share”
- “Button3” to “Clear”

3. Adding functions to your app
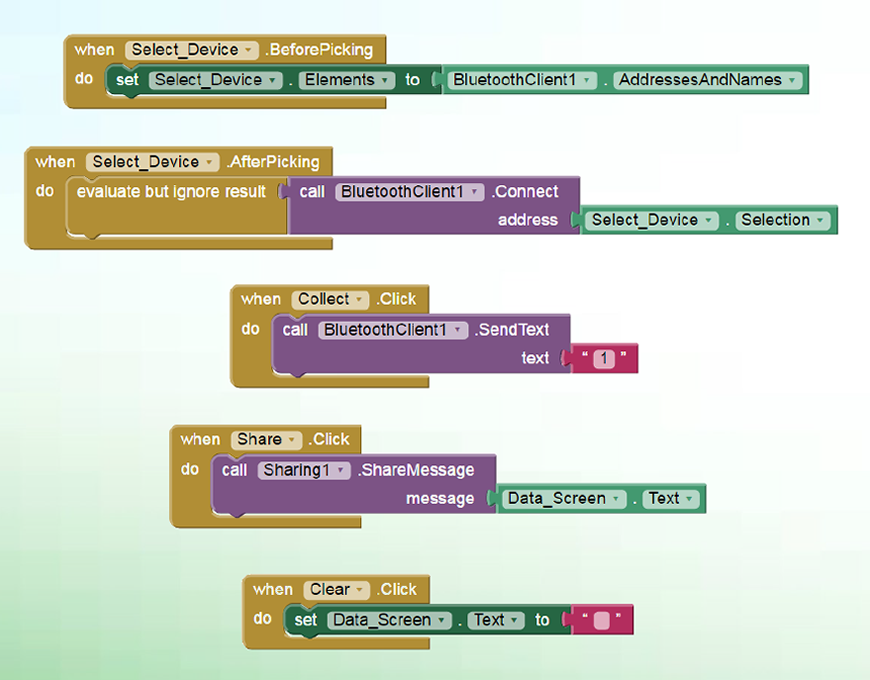
To add functions to your app, click on the “Blocks” button on the upper right side of the window. A white viewer should appear with a “Blocks” sidebar to the left.
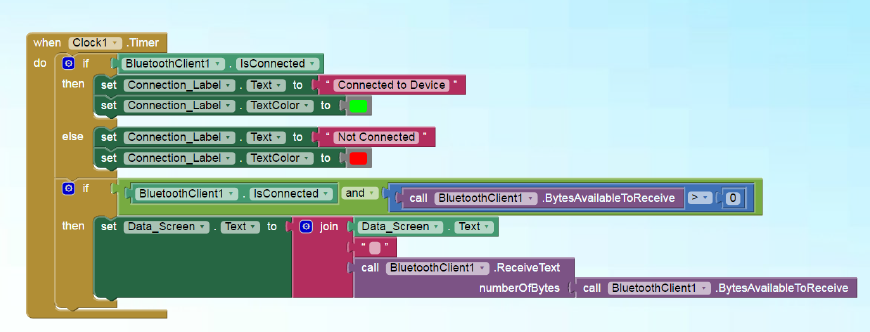
By clicking on items in the sidebar, you will open a new menu with functions specific to that item. Using these function blocks, you can build chains to create functions for specific buttons. More “if“, “then“, and “else“ statements can be created by clicking the blue gear of the parent block if required. Build the following chains in the viewer:
4. Downloading your app
Congratulations! You have now finished designing your app!
To download the app on your mobile device, click on the “Build” drop-down menu,
and select “App save .apk to my computer” and be sure to save it to a location where you will be able to find it.
Then upload the .apk file to Google Drive, where you can then download it on your mobile device.
In order to connect to the Bluetooth module, you will have to pair the devices through your phone settings.
Be sure to pair with “HC-05”. The password is “1234”.
5. Collecting data
On the app, you should be able to click “Select Device” and choose a Bluetooth module.
Then by hitting “Collect”, the data from the Arduino should start appearing on the data screen.
By clicking “Clear, you clear the data screen, and by clicking “Share” you can send the data in an email.
After you recieve your data in an email, you may plot it on a graph using Microsoft Excel,
or some other graphing software. The next page will teach you how to interpret your data.